I was invited to speak at the Open TEL Learning at Scale Special Interest Group about my work on the Fleming project. I am the Data Analytics lead of the Fleming fund project at the Open University, which is also the global learning lead for Fleming.
In my presentation, I focused on how I compile the quarterly reports for the funder. The funder wants to know about key metrics such as enrollments, completions, badges, etc. The problem is that there are 25 modules and 10 pathways, and each has several data reports that need to be downloaded from OpenLearn Create (OLC) and summarised.
I downloaded around 150 CSV files from OLC for each quarterly report in total, and then I needed to make sense of these 150 files.
The solution to this problem was to create a programme that takes all the data and creates a data report, which summarises all that data into a handful of key metrics, which the funder is interested in. For this, I developed a custom R script that creates Markdown, which can then be rendered into a bespoke report with text and tables. R is an open-source and freely available statistical data environment. We had a good experience with R previously. For example, I created the Open University key metrics reports for our internal quality enhancement process for two consecutive years with this technology before the introduction of the dashboards.
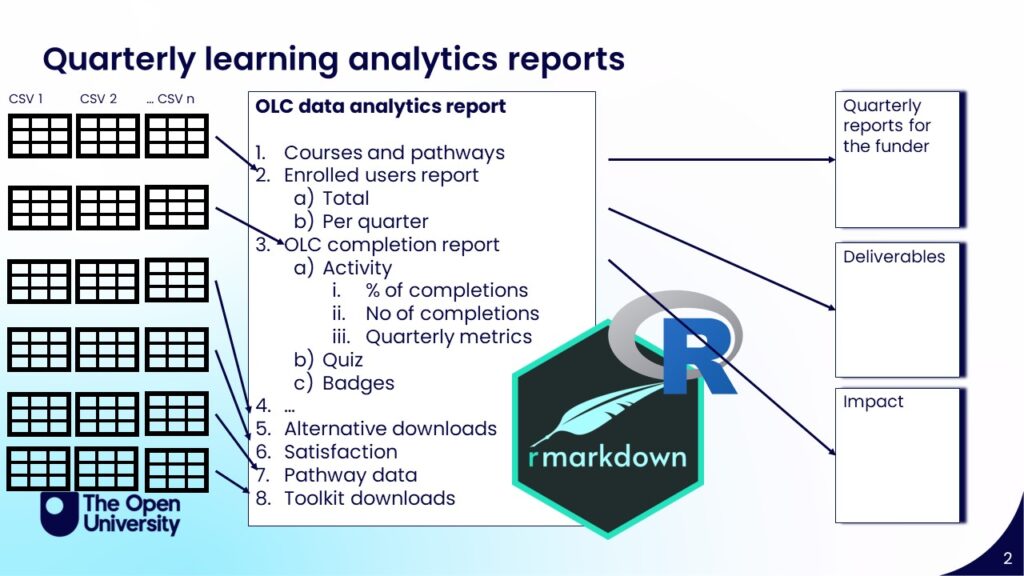
The report contains sections for each key metric, such as enrolment information, activity and quiz completion measures, satisfaction scores, downloads, Adobe Analytics Web log statistics, etc. The generated data tables and data points serve multiple purposes, such as creating the quarterly report for the funder but also for research and impact measures.